
Turn spreadsheet data into decision-ready dashboards in minutes.
Chitralytix helps teams import business data, build clean visual reports, and uncover trends faster — without adopting a heavyweight BI stack.
- < 5 min
- Time to first dashboard
- 14+
- Chart types supported
- 100%
- Browser-local by default
- 0
- SQL queries required
Why teams switch
Reporting should not depend on spreadsheet chaos or an enterprise BI rollout.
Most teams already have the data they need — the problem is turning it into something useful without manual effort or expensive tooling. Chitralytix gives you a direct path from exported data to charts, dashboards, and decisions.
How it works
From raw data to shareable dashboards in three steps.
Step 01
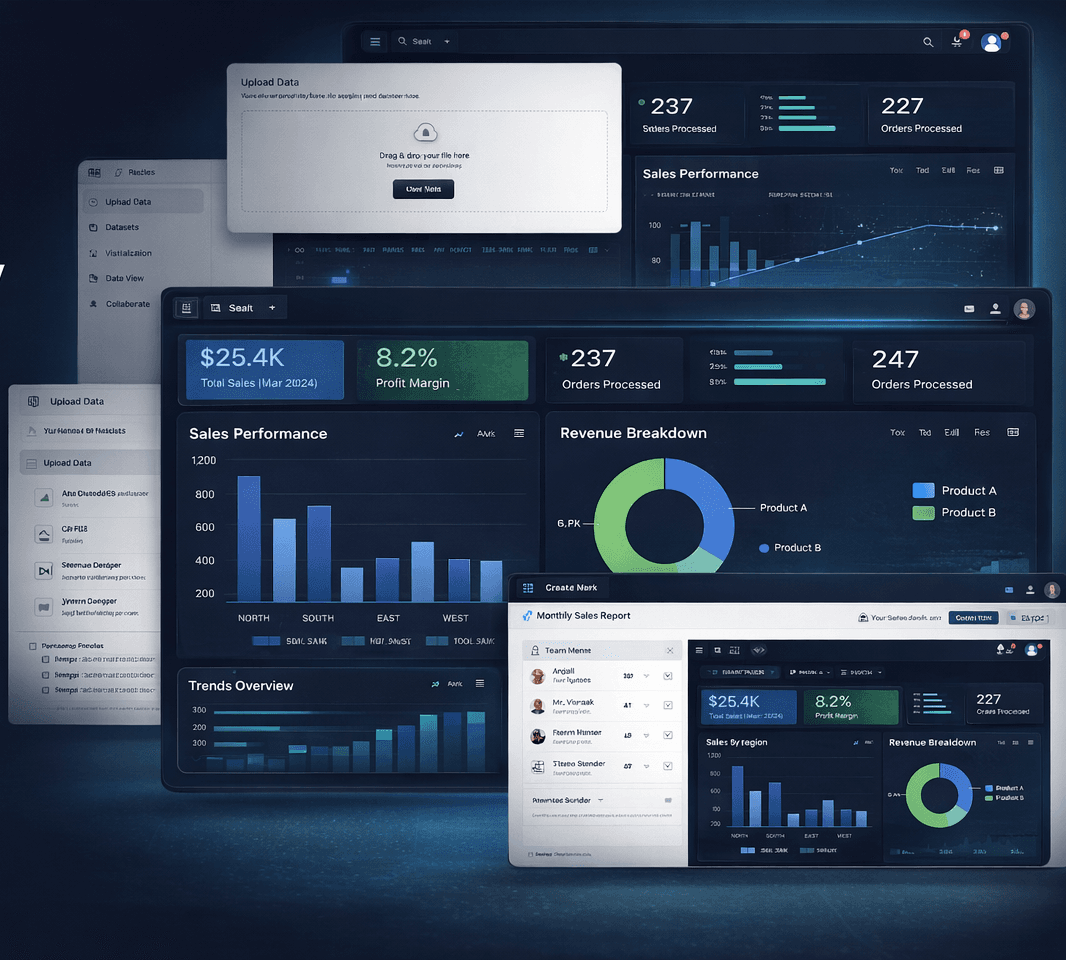
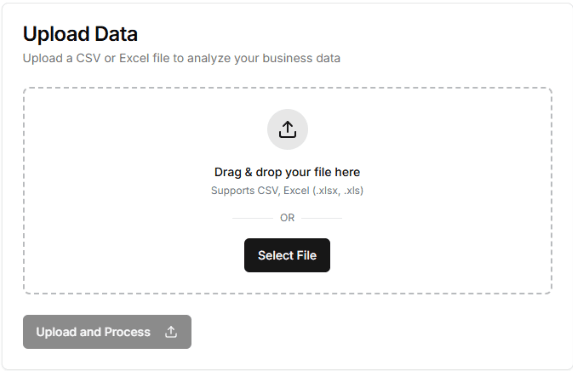
Import your data
Upload CSV or Excel files and start from the data your team already uses every day.
Step 02
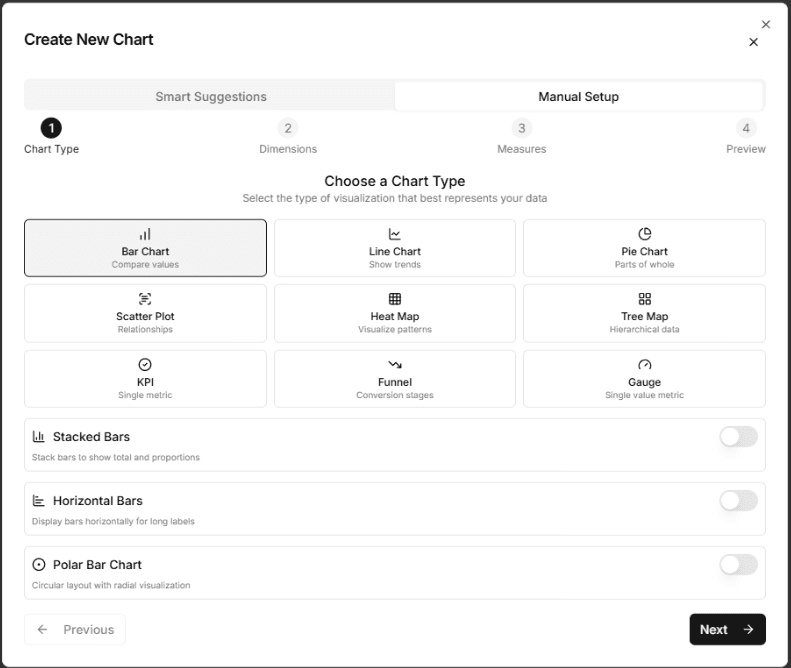
Generate charts and dashboards
Turn raw rows into clean visual reports with filters, groupings, and reusable dashboard layouts.
Step 03
Share insights faster
Give teams and decision-makers a clearer view of performance without waiting on a complex BI stack.
Key benefits
Everything you need to go from data to decisions — nothing you don't.
Fast visual reporting
Build line, bar, pie, and summary views that help teams move from data to decisions faster.
Spreadsheet-friendly imports
Start with CSV and Excel files so operations, finance, and business teams can work from familiar data sources.
Flexible dataset updates
Refresh dashboards with full uploads or incremental updates as your reporting cycle evolves.
Custom dashboard layouts
Arrange charts around the KPIs your team actually tracks instead of forcing everyone into a rigid template.
Analysis that stays practical
Filter, group, and compare data to uncover what changed, what matters, and where to act next.
Privacy-first by design
Use a workflow built for teams that care about keeping sensitive business data under tighter control.
Best fit
Built for teams that need answers quickly, not another complex rollout.
Sales and revenue reporting
Track growth, region performance, pipeline health, and trends without spending hours rebuilding the same reports.
Operations visibility
Monitor volumes, exceptions, turnaround time, and team output in one place instead of across disconnected spreadsheets.
Founder and leadership dashboards
Create presentation-ready visual summaries for reviews, updates, and investor conversations with less manual work.
Why Chitralytix
Practical analytics, without the enterprise overhead.
Most BI tools are built for data teams with time to set them up. Chitralytix is built for business teams who already have the data and just need a faster, cleaner way to see what it means.
FAQ
Everything you need to know before getting started.
Who is Chitralytix best for?
Chitralytix is designed for teams that already work with Excel or CSV data and want to turn those spreadsheets into interactive dashboards quickly. It works well for founders, operators, analysts, finance teams, and consultants who need insights without setting up complex BI infrastructure.
Do I need a BI or data engineering team to use it?
No. Chitralytix is built so business users can upload data, create visualizations, and build dashboards themselves. The system automatically suggests charts based on the structure of your dataset, making it easy to get started even without technical expertise.
What types of data files can I upload?
You can upload Excel (.xlsx, .xls) or CSV files. Once uploaded, the data becomes a dataset that you can visualize, extend, update with new data, and use to build dashboards.
Where is my data stored?
By default, datasets are stored locally in your browser. This allows you to analyze data instantly without uploading it to a server. If you want to access the same dataset across devices or collaborate with teammates, you can sync it securely to the cloud.
Can I update a dataset after uploading it?
Yes. You can append new data, replace the dataset entirely, or maintain a history of updates. This makes it easy to keep dashboards current when your data is refreshed periodically.
What are custom or virtual columns?
Custom columns (also called virtual columns) allow you to create new dimensions or measures derived from existing data. For example, you can calculate profit margins, create categories, combine fields, or define custom metrics without modifying the original dataset.
How does Chitralytix help me create charts faster?
After uploading a dataset, the system analyzes its dimensions and measures and suggests relevant charts automatically. This helps you quickly build meaningful dashboards without manually configuring every visualization.
Can I manually configure charts as well?
Yes. In addition to smart suggestions, you can manually create charts by choosing the chart type, dimensions, and measures. This gives you full flexibility to design dashboards that match your reporting needs.
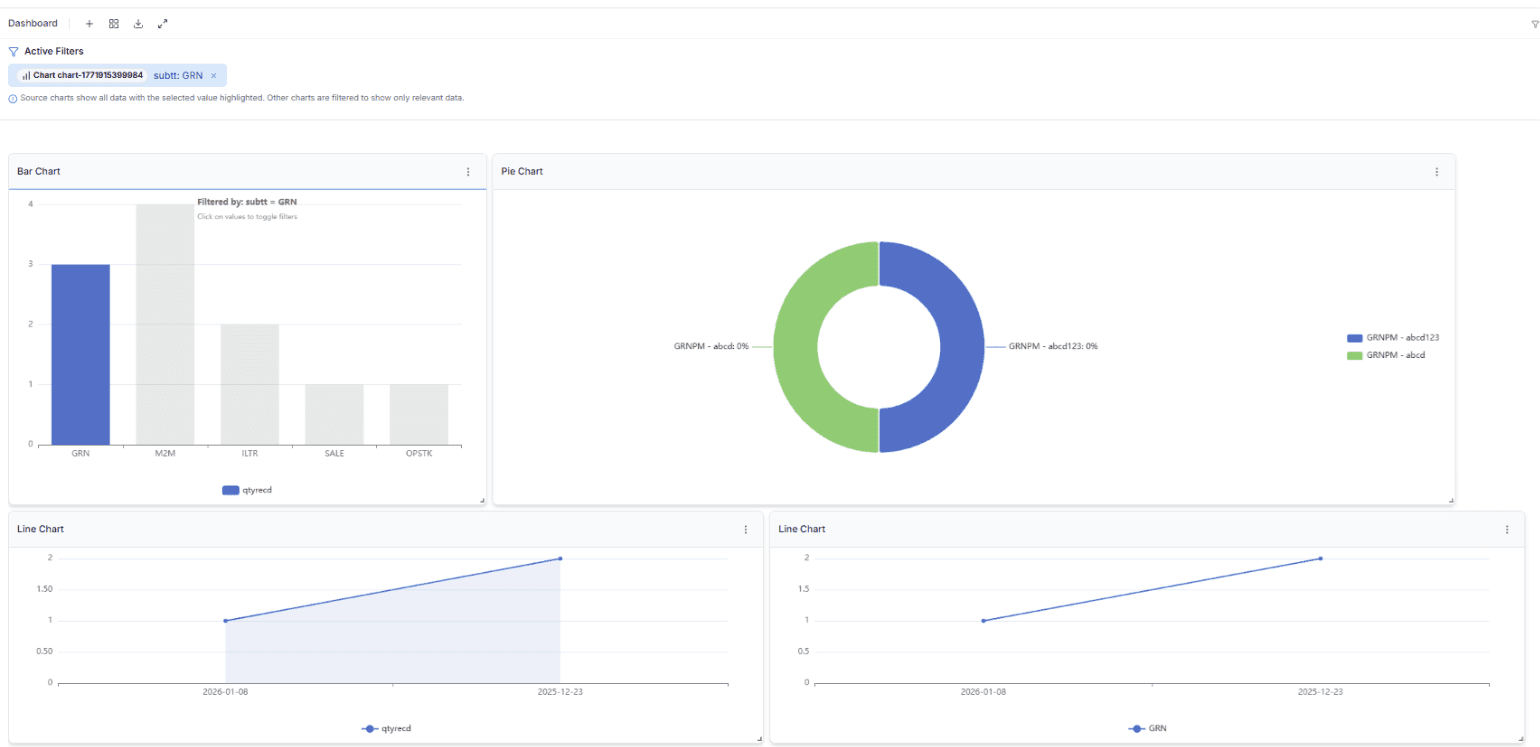
Do charts interact with each other in the dashboard?
Yes. Chitralytix supports interactive cross-filtering. When you click on an element in one chart, other charts automatically update to reflect the selected data. This helps users explore patterns and drill into insights more easily.
Can I collaborate with my team?
Yes. If a dataset is synced to the cloud, you can invite team members and control their access levels such as view, modify, or admin permissions. This allows teams to work together on shared datasets and dashboards.
Can I share dashboards without cloud access?
Yes. You can export a dataset along with its visualizations and dashboards as a file. The export can optionally be encrypted. Your teammates can import the file into their workspace to view or continue working with the dashboard.
Does Chitralytix track changes to datasets?
Yes. When datasets are synced to the cloud, the system tracks modifications to both data and visualizations. You can choose to sync those changes or revert back to the previously synced version if needed.
What types of visualizations can I create?
Chitralytix supports a wide range of visualizations including bar charts, line charts, pie charts, scatter plots, heatmaps, funnels, KPI metrics, gauges, and more. These can be combined into interactive dashboards.
How quickly can I create my first dashboard?
Most users can create their first dashboard in minutes. Upload a spreadsheet, review the chart suggestions, and add visualizations to the dashboard to start exploring your data.
Your data is already there. Your dashboards should be too.
Upload a spreadsheet, generate your first dashboard in minutes, and see exactly what Chitralytix can do for your team — no setup, no SQL, no waiting.